
Campaign intelligence, end to end.
Every platform pulled into one view. Automated insights on demand. Client-ready presentations in seconds.
Cross-platform analytics via APIs or MCP
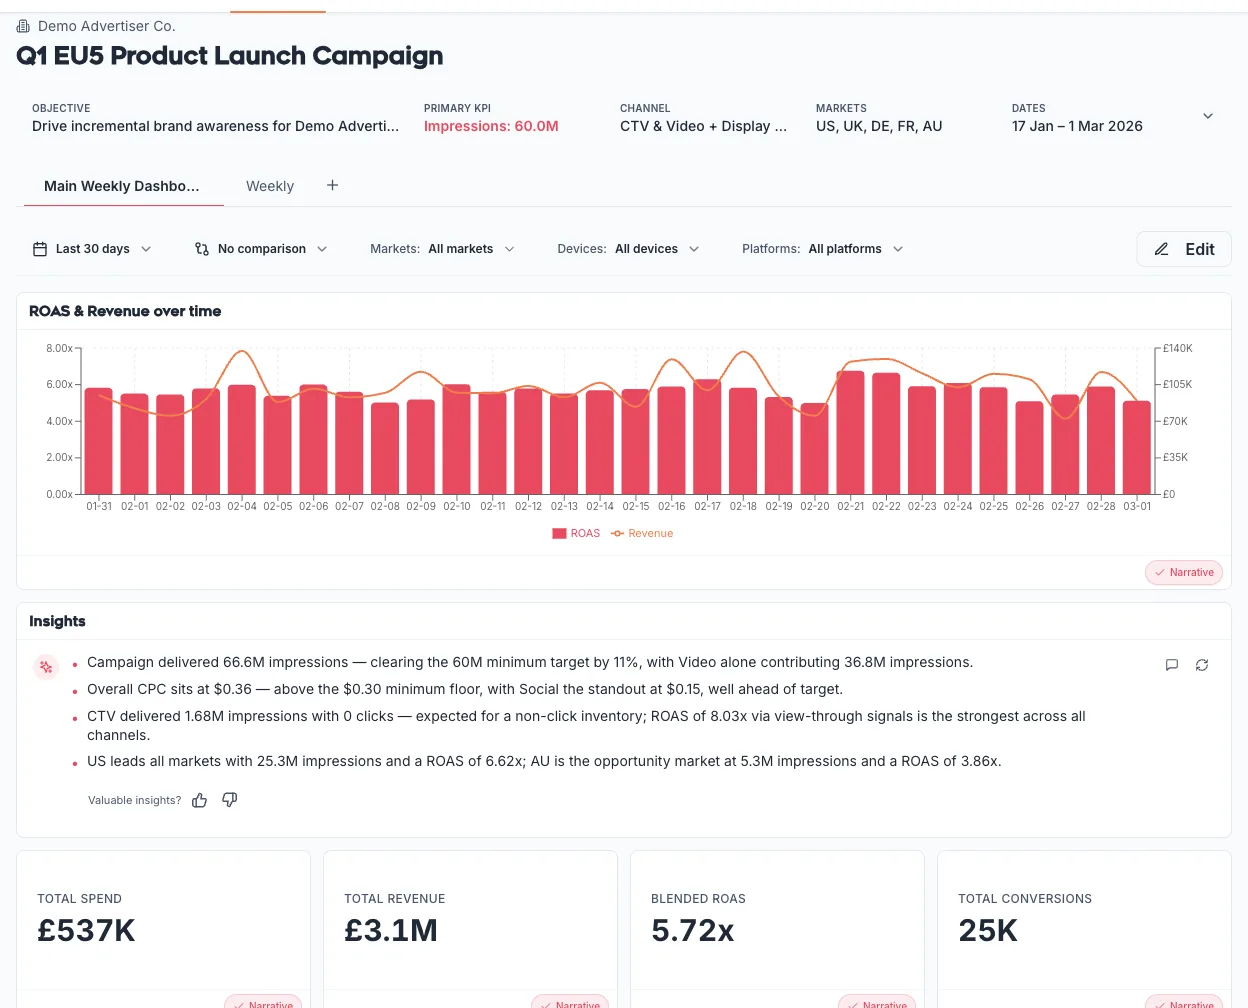
Every major ad platform, pulled in via APIs or MCP, unified in one view. No more switching tabs, exporting CSVs, or stitching together spreadsheets. Hourly or daily, automatically.
- Every major platform via APIs or MCP: DSPs, social, search, video
- Unified hourly or daily cross-platform views
- Automatic data normalisation across naming conventions and metrics
- Manual upload supported for proprietary data sources





Automated insight, and the optimisations to act on
Insight and ranked optimisations with the evidence behind each, and the means to act on them without leaving Media Ridge.
- Auto-generated insight on every chart, KPI, and narrative
- Optimisations prioritised by impact, with the supporting data shown
- Apply them on supported platforms, with your team approving each change
- Or hand over fully, per account, inside guardrails you set
- Optimisation impact, surfaced in every report
Vertical benchmark analysis
Campaign results set against industry benchmarks, not a generic average, and not just against the last campaign. Every number arrives with the context to judge it.
- Performance vs vertical-specific benchmarks
- Automatic trend and anomaly detection
- Quartile positioning for every core metric
- Natural-language insight summaries
Your CTR sits in the top quartile for the retail vertical, 50% above category average over the last 30 days.
Creative analysis
Which creative worked, which did not, and why. Colour, composition, product placement and wording, analysed from the creative itself and joined to its performance data, with the evidence shown next to the numbers, and fatigue forecast platform by platform.
- Colour, composition, product placement and wording, analysed per creative
- Top, average and underperforming cohorts, each with the data behind it
- Fatigue status and forecast date, per creative and per platform
- Rising cost per click measured against each creative's own best
- New variants from what your winners share, held for human approval
Presentations, in any branding
Daily, Weekly or Post Campaign reports, at any time and in any branding. Campaign stories as shareable web presentations, or native PowerPoint and Google Slides, and chat to any of them to edit.
- Executive summaries written for you, on every report
- Any logo, colours and fonts, applied to every chart and deck
- Shareable web presentations, or native PowerPoint and Google Slides
- Chat in natural language to edit copy, images and layouts (native add-ins for both)
Enterprise-grade security
Built on cloud infrastructure whose providers are certified to SOC 2 Type II. Primary campaign data is stored in the EU (Ireland), with named sub-processors in the EU and the US. We never use your campaign data to train AI models.
- Cloud providers certified to SOC 2 Type II
- Primary data storage in the EU (Ireland), sub-processors in the EU and the US
- Your data never used for model training
- Full detail on our security page
Ready to see every platform in one view?
Book a 15-minute demo and see how Media Ridge turns siloed platform data into automated insight, every day.
Book a Demo